Make Google Ads Performance Max reporting explainable in Google Sheets.
Current status
PMax IcePulse is currently distributed as a working demo.
The Google Sheets Apps Script part still requires Google OAuth verification on our side. Until that is fully approved, some users may still see a standard Google warning during authorization. The product is functional, but the installation flow is not fully polished yet.
IcePulse pulls raw Performance Max data into a spreadsheet and turns it into a practical monitoring dashboard.
It is meant for teams who want to understand how Performance Max shifts over time without building a full warehouse or BI stack first.
Depending on your config and enabled tabs, IcePulse can show:
- channel insight
- search term insight
- product insight
- landing page insight
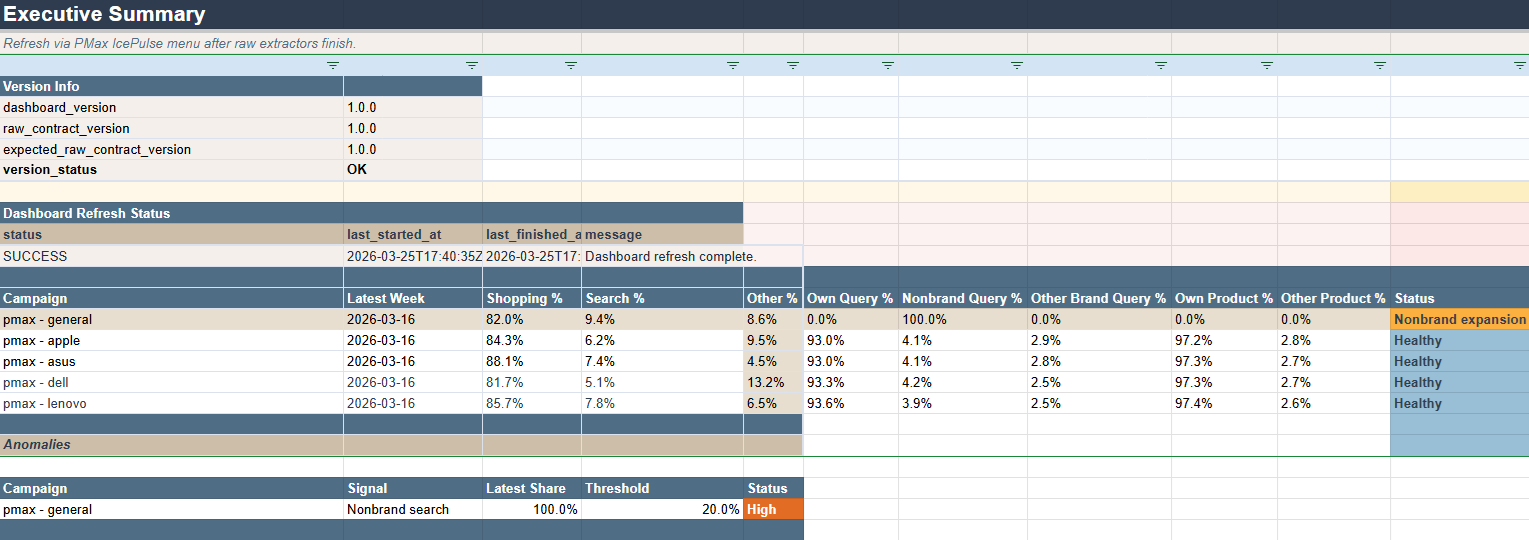
- summary table with drift signals
- overview charts
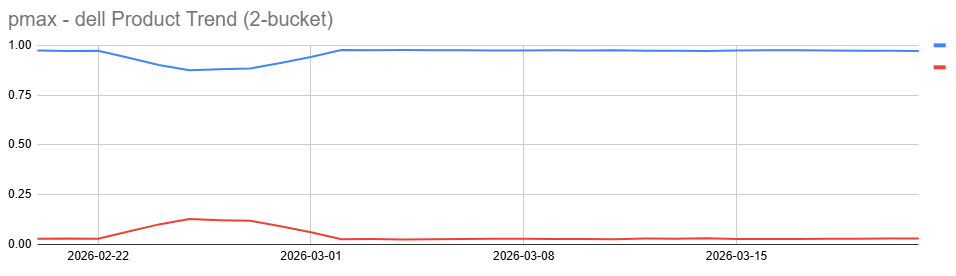
- rolling trend charts
IcePulse keeps the setup transparent in two layers:
Google Ads Scripts export the raw data.
The spreadsheet script rebuilds summaries, trends, and views.
Installation
The setup is intentionally lightweight. Raw extraction stays simple, business logic stays in the spreadsheet, and the dashboard can be adapted per account.
Step 1
Copy the dashboard sheet template into your own Google Drive.
Step 2
Add the bound Google Sheets Apps Script and reload the spreadsheet.
Step 3
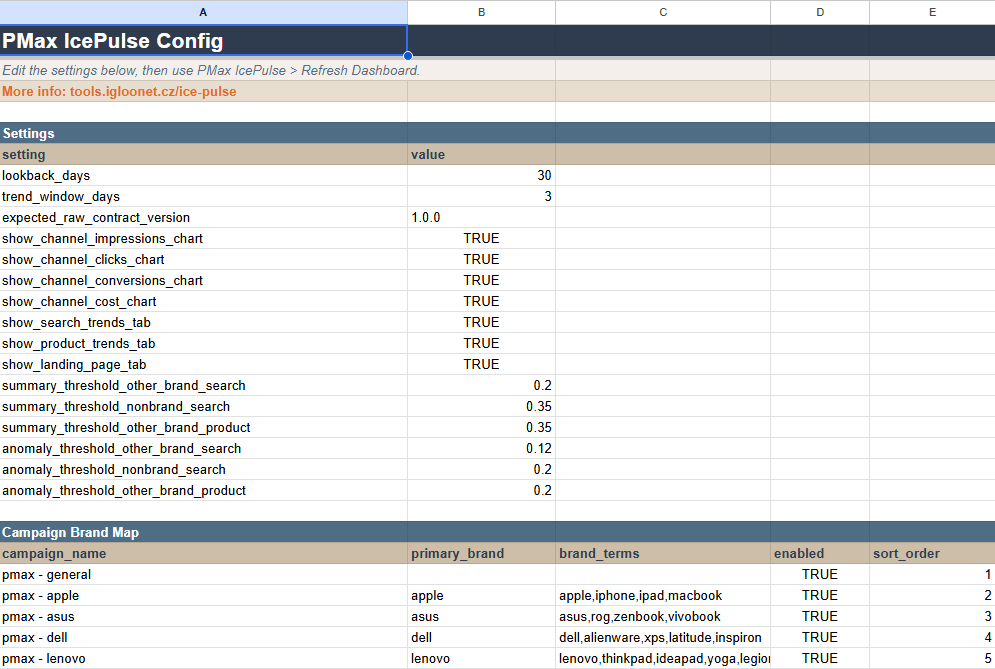
Configure lookback, trend window, brand mapping, thresholds, and enabled tabs.
Step 4
Install the four Google Ads extractor scripts and set the spreadsheet URL.
Step 5
Run the extractors in shorter windows first, then refresh the dashboard.
Dashboard screenshots
The dashboard is configured directly in the sheet and then rebuilt from the raw extractor tabs into an executive summary and trend views.
Help and privacy
IcePulse is designed to work inside the user's own Google Sheet. It reads raw data already present in the spreadsheet, writes modeled tables and charts back into that same spreadsheet, and stores only minimal operational metadata.
Google warning during authorization
The dashboard Apps Script may still show a Google warning while OAuth verification is pending. The extractor scripts are not affected by that warning.
Dashboard stays blank
Check whether the raw tabs contain data, whether campaign names match the config exactly, and whether the bound script code is current.
The dashboard feels slow
Reduce lookback_days, disable less important charts, and keep heavier tabs such as landing page insight off initially.
Privacy questions: marketing@igloonet.cz